Pandas is Magic

Pandas is a hugely popular Python library for doing data analysis. After having used it for around a year now I can safely say that it deserves all off the hype that it gets.
Pandas is mostly know for its use in the data science space. Since I'm in no way a data scientist I initially avoided it–I'm not working with big data after all–not even close. But the fact is that Pandas is so incredibly useful for working with tabular data of any kind and any size. And it's perfect for doing the kinds of ad-hoc reporting and mashing-together of spreadsheets that comprises much of my daily work.
There are a few "killer" features of Pandas in my opinion and, of these, only one or two are technical in nature. Mostly it just does simple things very very well. Here are some of my favorite features:
1. It is dead simple to read in data of almost any kind (JSON, CSV, Excel, SQL..):
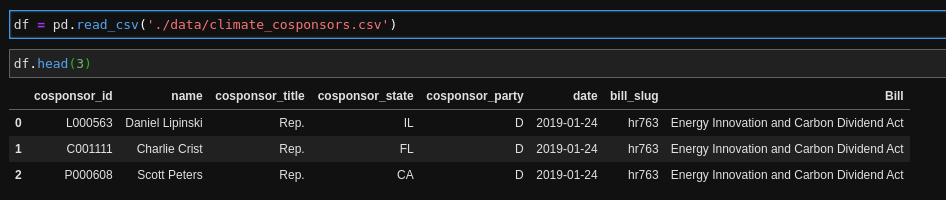
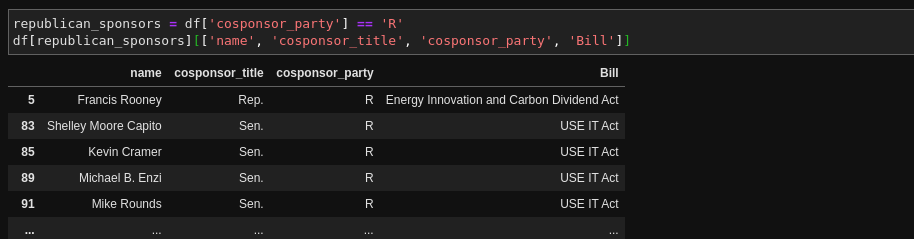
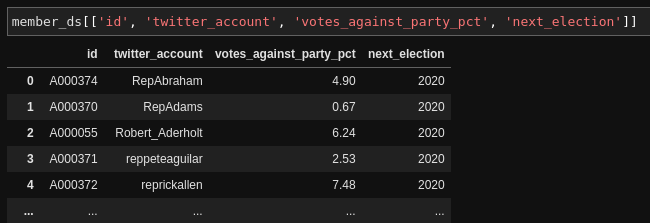
2. Pandas displays data in clean, well-formatted HTML tables. And you can slice and dice the data however you like. I had no appreciation for how much mental energy I was expending trying to make sense of data smashed together in the console back what I was using Ruby to work with data like this. Here I'm looking at a few columns for just Republican cosponsors:
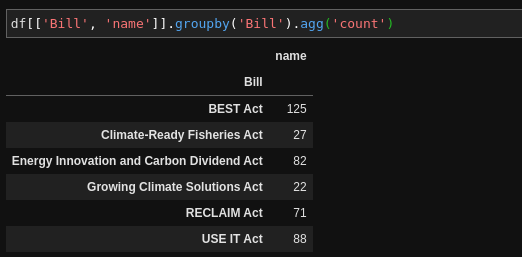
3. Pandas makes grouping and summarizing data dead simple. Say we want counts for each of our bills:
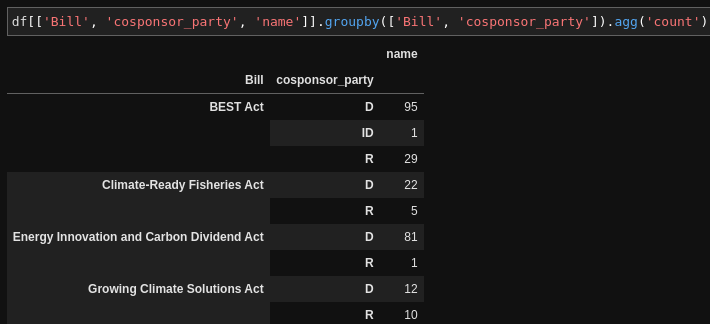
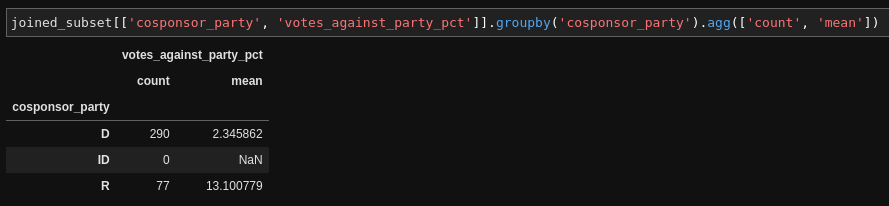
Or counts by party for each bill:
4. If you need to bring in data from another spreadsheet or table, it's very simple to join it to your dataset based on a similar key. In this case we have a table of congressional member data that includes how often a member of congress votes against their party. For members who are cosponsoring these climate bills, let's add that percentage, their Twitter handle, and the year that they are next up for election:
The common field is the id field in the member table, which corresponds to the cosponsor_id field in the cosponsor dataset:
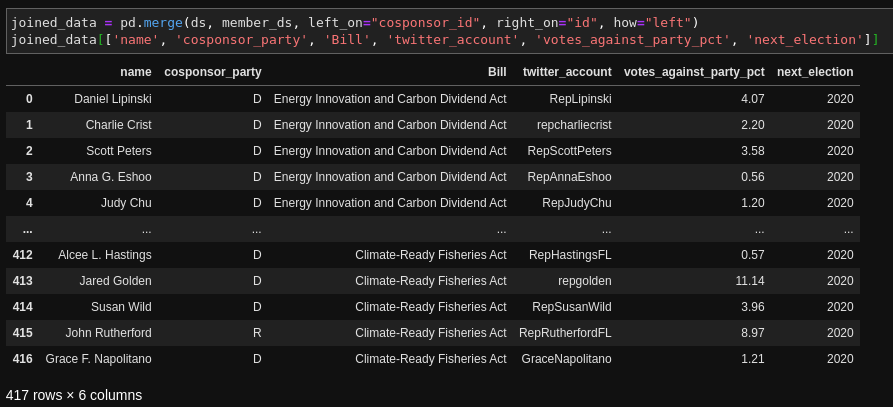
In this case we use pd.merge and pass it the cosponsor dataset ds and the member dataset member_ds second. the left_on and right_on arguments are saying which ID fields we're using for the join and the how=left means that we want all of the cosponsor records, even if they don't have a corresponding record in the member table. I did that here becuase my member dataset only has house members.
With the output you can see that we now have those new fields from the member table. This would be similar to the vlookup function to join together Excel tables.
Now that we have this joined data we can do really cool stuff, like see how many Democrat vs Republican members are on these bills, and how often they vote against their party:
5. Lasty, Pandas is wicked fast. Python is not known to be the most highly-performant language out there, so how does it accomplish this speed and efficiency? The trick is that Pandas is based on NumPy, which is a numerical analysis library. NumPy does a lot of its actual work in C rather than Python. That means that it can be very memory-efficient, and can do highly concurrent operations. From what I understand (and we're outside my area of expertise here) when you do things like index on a Pandas column, or apply some operation on it, NumPy is vectorizing that process across all of the rows.
Since Pandas is so widely-used, there are a huge number of libraries and utilities that work with it. In particular graphing and data visualization libraries can easily take in Pandas dataframes and graph them out. One of my favorites is Altair. Let's graph out our co-sponsor dataset, looking at the count of cosponors on each bill:
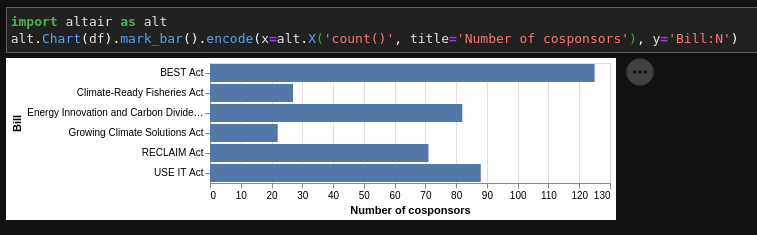
Not bad for one line right?
I could go on and on but this gives you a small idea of the kinds of things you can do with Pandas. As I mentioned above I'm no data expert–I use a tiny fraction of the features that this library offers–but you can see how quickly and easily we can read in, look at, and manipulate data for these simple scenarios. When searching for resources and tutorials on Pandas, I found that much of it was aimed at data scientists and was tough to follow. One of the best courses that I found was Move from Excel to Python with Pandas by Talk Python. It does a great job of walking through scenarios like this one, and shows the what the corresponding grouping/joining/pivoting operations would be within Excel.
Note: Data here was taken from the ProPublica Congress API